October 2024 - Bank of Israel Economic Outlook

October 2024 - Bank of Israel Economic Outlook

October 2024 - Bank of Israel Economic Outlook

October 2024 - Bank of Israel Economic Outlook

October 2024 - Bank of Israel Economic Outlook

October 2024 - Bank of Israel Economic Outlook

October 2024 - Bank of Israel Economic Outlook

October 2024 - Bank of Israel Economic Outlook

October 2024 - Bank of Israel Economic Outlook

October 2024 - Bank of Israel Economic Outlook

October 2024 - Bank of Israel Economic Outlook

October 2024 - Bank of Israel Economic Outlook

October 2024 - Bank of Israel Economic Outlook

October 2024 - Bank of Israel Economic Outlook

October 2024 - Bank of Israel Economic Outlook

October 2024 - Bank of Israel Economic Outlook

October 2024 - Bank of Israel Economic Outlook

October 2024 - Bank of Israel Economic Outlook

October 2024 - Bank of Israel Economic Outlook

October 2024 - Bank of Israel Economic Outlook

October 2024 - Bank of Israel Economic Outlook

October 2024 - Bank of Israel Economic Outlook

October 2024 - Bank of Israel Economic Outlook

October 2024 - Bank of Israel Economic Outlook

October 2024 - Bank of Israel Economic Outlook

October 2024 - Bank of Israel Economic Outlook

October 2024 - Bank of Israel Economic Outlook

October 2024 - Bank of Israel Economic Outlook

October 2024 - Bank of Israel Economic Outlook

October 2024 - Bank of Israel Economic Outlook

October 2024 - Bank of Israel Economic Outlook

October 2024 - Bank of Israel Economic Outlook

October 2024 - Bank of Israel Economic Outlook

October 2024 - Bank of Israel Economic Outlook

October 2024 - Bank of Israel Economic Outlook

October 2024 - Bank of Israel Economic Outlook

October 2024 - Bank of Israel Economic Outlook

October 2024 - Bank of Israel Economic Outlook

October 2024 - Bank of Israel Economic Outlook

October 2024 - Bank of Israel Economic Outlook

October 2024 - Bank of Israel Economic Outlook

October 2024 - Bank of Israel Economic Outlook

October 2024 - Bank of Israel Economic Outlook

October 2024 - Bank of Israel Economic Outlook

October 2024 - Bank of Israel Economic Outlook

October 2024 - Bank of Israel Economic Outlook

October 2024 - Bank of Israel Economic Outlook

October 2024 - Bank of Israel Economic Outlook

October 2024 - Bank of Israel Economic Outlook

October 2024 - Bank of Israel Economic Outlook

October 2024 - Bank of Israel Economic Outlook

October 2024 - Bank of Israel Economic Outlook

October 2024 - Bank of Israel Economic Outlook

October 2024 - Bank of Israel Economic Outlook

October 2024 - Bank of Israel Economic Outlook

October 2024 - Bank of Israel Economic Outlook

October 2024 - Bank of Israel Economic Outlook

October 2024 - Bank of Israel Economic Outlook

October 2024 - Bank of Israel Economic Outlook

October 2024 - Bank of Israel Economic Outlook

October 2024 - Bank of Israel Economic Outlook

October 2024 - Bank of Israel Economic Outlook

October 2024 - Bank of Israel Economic Outlook

October 2024 - Bank of Israel Economic Outlook

October 2024 - Bank of Israel Economic Outlook

October 2024 - Bank of Israel Economic Outlook

October 2024 - Bank of Israel Economic Outlook

October 2024 - Bank of Israel Economic Outlook

October 2024 - Bank of Israel Economic Outlook

October 2024 - Bank of Israel Economic Outlook

October 2024 - Bank of Israel Economic Outlook

October 2024 - Bank of Israel Economic Outlook

October 2024 - Bank of Israel Economic Outlook

October 2024 - Bank of Israel Economic Outlook

October 2024 - Bank of Israel Economic Outlook

October 2024 - Bank of Israel Economic Outlook

October 2024 - Bank of Israel Economic Outlook

October 2024 - Bank of Israel Economic Outlook

October 2024 - Bank of Israel Economic Outlook

October 2024 - Bank of Israel Economic Outlook

October 2024 - Bank of Israel Economic Outlook

October 2024 - Bank of Israel Economic Outlook

October 2024 - Bank of Israel Economic Outlook

October 2024 - Bank of Israel Economic Outlook

October 2024 - Bank of Israel Economic Outlook

October 2024 - Bank of Israel Economic Outlook

October 2024 - Bank of Israel Economic Outlook

October 2024 - Bank of Israel Economic Outlook

October 2024 - Bank of Israel Economic Outlook

October 2024 - Bank of Israel Economic Outlook

October 2024 - Bank of Israel Economic Outlook
USD/ILS Exchange Rate Correlation with NASDAQ & S&P 500: 2026 Analysis | Israeli Shekel Forecast
Empirical Market Research · Tel Aviv Real Estate Intelligence

The Shekel & The Nasdaq:
A Tale of Two Markets

How Wall Street became Israel’s de facto central bank — and why the most consequential shift in 2025 may be the decoupling that nobody expected

Executive Summary

For most of Israel’s modern financial history, the shekel’s fate against the dollar was shaped by familiar macro forces: interest rate differentials, geopolitical risk premiums, trade balances, and capital flows from the diaspora. All of that changed between roughly 2014 and 2018, when a structural transformation in Israel’s pension system created a new, powerful, and largely invisible mechanism linking the USD/ILS exchange rate directly to the performance of US equity markets — specifically the S&P 500 and Nasdaq.

The empirical evidence, including peer-reviewed research from Tel Aviv University and the Bank of Israel’s own data, is unambiguous: since approximately 2015, and with high statistical significance after 2018, the USD/ILS exchange rate has moved in strong negative correlation with the S&P 500. When Wall Street rises, the shekel strengthens. When it falls, the shekel weakens. The mechanism is not coincidence — it is structural, and it operates through the portfolio rebalancing behavior of Israel’s giant institutional investors.

Today, in February 2026, this relationship is under profound stress. The dollar has fallen ~12–14% against the shekel since early 2025. This move has been amplified by three forces acting simultaneously: the institutional rebalancing mechanism (still operational), a dramatic weakening of the dollar against all major currencies (the DXY fell ~10% in H1 2025 alone — its worst first-half performance since 1973), and idiosyncratic Israeli factors including tech exits, ceasefire optimism, and energy deals. The question for every dollar-denominated investor in Israeli real estate is: which of these forces will dominate in 2026 and beyond?

−14%
USD/ILS Change 2025
Dollar vs. shekel. From ~3.60 in Jan 2025 to ~3.07 by Feb 2026. Strongest shekel in 4 years.
−0.65
Correlation Coefficient
Post-2018 rolling 60-month r between monthly S&P500 % change and USD/ILS % change. Statistically robust.
₪2.5T
Assets Under Management
Israeli institutional investors (pension, provident, insurance) as of mid-2024 — the rebalancing engine.
◆ ◆ ◆

Part I — The Long-Term Historical Relationship (2000–2025)

The starting point for any serious analysis of USD/ILS must be the structural evolution of the exchange rate itself. The shekel has undergone a remarkable long-term appreciation trend against the dollar, moving from above 4.50 in the early 2000s to a range of 3.00–3.80 in the mid-2020s. But within that secular trend, the correlation with US equities has not been constant — it has evolved across three distinct regimes.

The Three Regimes

Figure 1 · Long-Term Analysis
USD/ILS Exchange Rate vs. Nasdaq 100 Index (Indexed to 2000=100)
USD/ILS Rate (inverted) Nasdaq 100 (indexed) Regime Break
Source: Bank of Israel, Yahoo Finance, Federal Reserve FRED. Annual averages. USD/ILS axis inverted to show shekel strength directionally.
Period Regime USD/ILS Range Correlation (r) Dominant Driver
2000–2008 Geopolitical / Trade 3.8–4.7 Weak / Mixed (~0.10) Intifada, wars, trade balance, BoI policy
2009–2014 Post-Crisis / Partial 3.5–4.2 Moderate positive (~0.25) Risk-off global sentiment; shekel weakened with S&P during crisis
2015–2019 Pension Reform Emergence 3.4–4.0 Negative (−0.40 to −0.55) Institutional rebalancing begins; S&P rise → shekel strengthens
2019–2023 Mirror-Image Regime 3.1–4.4 Strong negative (−0.60 to −0.72) Pension AUM explosion; every S&P decline → BoI FX purchases decline
2023–2026 Disrupted / Multi-Factor 3.07–4.15 Weakening (−0.30 to −0.50) War risk premium, global DXY decline, tech exits, ceasefire trade

What is striking about this table is the non-linearity of the relationship. The correlation did not always exist — it was manufactured by a specific structural event: Israel’s pension reform.

The Core Mechanism

Why S&P 500 Moves Drive the Shekel

Israel’s 2008 pension reform concentrated pension savings into a small number of large institutional investors (provident and pension funds). These funds grew from ~$78B in foreign-currency holdings in 2008 to ~$780B by mid-2022 — a 10-fold increase. As the local stock exchange (TASE) became too small to absorb this capital, institutions massively expanded into foreign assets, predominantly US equities.

This created an automatic rebalancing mechanism:

S&P 500 rises
Foreign asset portfolio gains
Portfolio % in USD overshoots target
Institutions sell USD, buy ILS
Shekel appreciates

The reverse is equally powerful: when US markets decline, institutions’ foreign % undershoots, they buy dollars to rebalance, weakening the shekel. Tel Aviv University research (Ben-Zeev & Nathan, 2023) quantified this: a $1 billion USD purchase by institutional investors depreciates the shekel by approximately 2.0–2.5%. By 2022, total AUM under management by Israeli institutional investors exceeded the total market capitalization of TASE by ~30%.

S&P 500 falls
Foreign portfolio underweight
Institutions buy USD
Shekel weakens
Real estate more expensive for dollar buyers
Figure 2 · The Correlation Evolution
Rolling 60-Month Correlation: S&P 500 Monthly Returns vs. USD/ILS Monthly Returns
Negative correlation means: when S&P rises, USD/ILS falls (shekel strengthens vs. dollar). Post-2018, correlation consistently −0.55 to −0.72. Source: Tel Aviv University Foerder Institute Working Paper 9-2023; Bank of Israel data.

Part II — Key Events & Regime Breaks

2002–2003
Dollar Peaks Above 4.90 ILS
Dotcom bust, Second Intifada, deep shekel weakness. US equity decline and Israeli geopolitical risk premium compound. No institutional rebalancing mechanism exists yet. Classic risk-off flow into dollars.
2008–2009
Global Financial Crisis — First Appearance of the Mechanism
S&P 500 collapses −38% in 2008. Shekel weakens from ~3.4 to above 4.1. This is the first time the post-reform embryonic mechanism is visible — but pension funds are still small, so the effect is muted. The BoI spends heavily to stabilize the shekel.
2012–2015
Shekel Structural Strength Emerges
S&P 500 in a sustained bull run. Pension fund AUM expands rapidly. For the first time, a clear pattern emerges: equity rallies consistently drive shekel appreciation. Correlation begins to solidify. USD/ILS drifts from 4.0 to 3.5.
2018
Correlation Becomes Mirror-Image
Tel Aviv University research marks 2018 as the year when S&P 500 and USD/ILS became “close to mirror images of one another.” Pension AUM in foreign currency has grown 10-fold from 2008. A $1B rebalancing trade now moves the shekel 2–2.5%.
March 2020
COVID Crash — Mechanism Stress Test
S&P 500 −19% in March 2020. Unlike October 2008, this time institutional funds are massive. They buy billions in USD to rebalance. Shekel briefly crosses 3.8. BoI sells $8.6B. This was the clearest single demonstration of the mechanism’s power.
January–September 2023
Judicial Reform Risk Premium
First major decoupling signal. The judicial overhaul protests create an Israel-specific risk premium. Shekel weakens to 3.7–3.9 even as the S&P rallied strongly. Correlation temporarily breaks as capital flees Israeli assets. Pure geopolitical override.
October 7, 2023
War Shock — Shekel Crosses 4.0
Hamas attack triggers immediate shekel collapse to above 4.00 — first time since 2015. S&P 500 is not falling. This is the most dramatic decoupling from the institutional mechanism in the modern era. BoI intervenes with $8.2B in FX sales to stabilize.
Q1 2024 – Q4 2025
The Great Shekel Recovery & Multi-Factor Rally
Shekel recovers and then exceeds pre-war levels, reaching 3.07–3.17 by Dec 2025. Multiple forces converge: ceasefire optimism, S&P bull run (institutional rebalancing), Armis/$7.75B tech exit, $35B natural gas deal with Egypt, continued aliyah. The global DXY decline amplifies all of this.
H1 2025
Global Dollar Collapse — New Layer Added
DXY falls 10.8% in H1 2025 — worst first-half performance since 1973. Trump tariffs, fiscal deficits, Fed independence fears, and global capital reallocation away from US assets weaken the dollar against virtually all currencies. The shekel benefits both from its own strength AND from a weak dollar globally.
◆ ◆ ◆

Part III — The Short-Term Departure (2023–2026)

Figure 3 · Recent Dynamics
USD/ILS Rate 2022–2026 vs. S&P 500 Performance
USD/ILS Rate (left axis) S&P 500 Index (right axis) Key Events
Data: Bank of Israel, Yahoo Finance. Key events marked: (1) Judicial reform crisis Jan-Sep 2023, (2) October 7, 2023, (3) BoI $8.2B intervention, (4) Ceasefire/recovery trade, (5) Trump tariff DXY shock Apr 2025.

What Has Changed

The short-term departure from the long-term correlation is not random — it reflects the emergence of additional independent variables that were absent or dormant in the 2018–2022 period:

1. Israel-specific risk premium has gone bidirectional. Before October 7, the risk premium was mostly theoretical. Today it is an active, quantifiable variable. When it spikes (war escalation, hostage crisis deadlock), it weakens the shekel independently of what S&P is doing. When it collapses (ceasefire deal, Hezbollah campaign success), it strengthens the shekel even faster than the institutional mechanism alone would predict. This creates “excess returns” relative to the S&P 500 signal.

2. The global dollar cycle has become an independent force. In the long-term (2018–2022) period, the DXY was relatively stable. The institutional rebalancing mechanism operated against a neutral dollar backdrop. In 2025, the DXY fell 10% — a generational move. The shekel now benefits from both its institutional mechanism AND from being a strong-fundamental currency in a weak-dollar world. A purely model-based prediction using only the S&P correlation would have predicted approximately 8% shekel strengthening from the institutional mechanism; the actual move was 14%, with the extra 6% coming from the global dollar cycle.

3. Tech exit capital flows have become lumpy but powerful. The Armis acquisition ($7.75B) alone creates hundreds of millions in shekel-conversion flows. When clustered with other exits, these create short-term spikes in shekel demand that are not driven by institutional rebalancing at all.

“People are essentially buying two products: the stock index, and a 100% dollar investment. On the day that Israel’s risk premium falls, they are liable to lose twice over: both a decline or stagnation in the index, and a fall in the shekel-dollar rate.” — Yaron Dayagi, Index Research, Globes 2024
Figure 4 · The Divergence From Model
Model-Predicted USD/ILS (S&P Correlation Only) vs. Actual USD/ILS — 2023–2026
Model prediction derived from applying historical −0.65 beta coefficient to S&P 500 monthly returns. Actual rate diverges below model (stronger shekel) due to: war premium unwinding, global DXY weakness, and tech exit flows. Divergence is structural, not noise.
◆ ◆ ◆

Part IV — Four Scenarios for the Shekel in 2026–2027

Any rigorous framework for projecting USD/ILS must model the interaction between three independent variables: (A) the S&P 500 / institutional rebalancing mechanism, (B) the global dollar cycle (DXY), and (C) Israel’s idiosyncratic risk premium. Each of these can be in a “positive” or “negative” state for the shekel. The matrix of possibilities produces the following four principal scenarios:

Figure 5 · Scenario Framework
Three-Variable USD/ILS Projection Matrix (12–24 Month Horizon)
Probability-weighted scenario paths. Base case (blue) reflects consensus. Bull (green) and Bear (red) reflect one-standard-deviation shifts. Extreme bear scenario (dark red) represents structural break in correlation. Width of band indicates confidence interval.
Probability: 25%

Scenario A: Full Return to Correlation — The “Normalization Bull”

The S&P 500 continues its bull run. Institutional investors rebalance quarterly, systematically selling dollars and buying shekels. The global DXY stabilizes or recovers modestly. Israel’s risk premium remains low as the Gaza ceasefire holds and normalization with Saudi Arabia advances. Tech exits continue at pace.

Under this scenario, the correlation fully re-establishes. Every 10% S&P gain produces approximately 4–6% shekel appreciation through the institutional mechanism. The global dollar factor adds a neutral-to-positive 0–2% tailwind for the shekel.

Target: USD/ILS 2.85–3.05 by end-2026
Probability: 35%

Scenario B: Correlation Holds, Variables Offset — The “Stable Range”

This is the most probable base case. The S&P 500 trades sideways to modestly higher. The institutional mechanism produces modest shekel support. The global DXY recovers partially (stabilizes around 100–104 on DXY) as tariff uncertainty eases and US growth data improves. Israel’s risk premium stays relatively contained.

Net result: the forces roughly offset. The shekel trades in a relatively stable range, with volatility driven by episodic news (hostage deals, Hezbollah incidents, Fed statements). No dramatic move in either direction.

Target: USD/ILS 3.00–3.30 by end-2026 (choppy)
Probability: 28%

Scenario C: Correlation Breaks — The “Re-Coupling Shock”

A US equity market correction of 15–25% (driven by tariff escalation, earnings miss, or Fed policy error) triggers the institutional rebalancing mechanism in the opposite direction: Israeli pension funds buy dollars to rebalance their underweight foreign positions. Simultaneously, if geopolitical tension re-escalates, a risk premium returns.

This is the scenario most dangerous for dollar-denominated Israeli real estate investors. They would see: (1) their USD/ILS rate deteriorate back toward 3.5–3.8, simultaneously with (2) their S&P 500-linked pension positions falling. A “double loss” as Yaron Dayagi warned.

Target: USD/ILS 3.40–3.80 by end-2026
Probability: 12%

Scenario D: Structural Divorce — The “De-Dollarization + War” Tail

A perfect storm of factors produces a permanent regime change. The global dollar loses safe-haven status more broadly (ongoing CEPR/Morgan Stanley concern), a major S&P correction occurs, Iran-Israel military escalation returns with regional widening, and/or a Trump-driven geopolitical realignment fundamentally changes capital flows to Israel.

Under this scenario, the historical correlation completely breaks — not temporarily, but structurally. The shekel could weaken sharply regardless of what US equities do, as Israel-specific risk becomes the dominant driver. The 4.0–4.5 range, seen as a floor previously, could be tested again.

Target: USD/ILS 3.80–4.40 by end-2026 (extreme volatility)
◆ ◆ ◆

Part V — The Weakening Dollar in Global Context

A Generational Dollar Cycle in Question

The analysis so far has treated the institutional rebalancing mechanism as the primary framework. But 2025 introduced a second, equally important framework: the possibility that the dollar itself is entering a multi-year secular decline cycle — independent of the S&P/shekel relationship.

The DXY fell approximately 10.8% in H1 2025 alone. This is not routine volatility. As J.P. Morgan Asset Management noted, this marked the dollar’s worst first-half performance in over 50 years. RBC Wealth Management’s analysis suggests the dollar bull cycle that began in 2008 may have peaked in September 2022, with DXY now down ~13% since that peak — consistent with the early stages of a historical bear cycle. Historical weak-dollar cycles have averaged ~40% declines from peak to trough over approximately 8–10 years.

Figure 6 · The Dollar Cycle
DXY Index Historical Cycles — Bull & Bear Phases (1985–2026)
Shaded regions: DXY bear cycles. Historical bear cycles average −40% over 8–10 years. The current potential bear cycle began Sept 2022. If historical pattern holds, further dollar weakness of 15–25% from current levels is possible. Source: Federal Reserve FRED, RBC Wealth Management.

Trump’s Tariff War: A Dollar Wildcard

The Trump tariff regime has introduced a paradox for dollar analysis. Tariffs are theoretically dollar-positive (higher import costs → inflation → higher rates → stronger currency). Yet in practice, “Liberation Day” (April 2, 2025) caused the dollar to fall alongside the VIX rising — an historically anomalous combination that broke the traditional “dollar as safe haven” paradigm.

The CEPR’s research found that “the co-movement of the dollar with market volatility shifted from generally positive to negative in April 2025” — meaning the dollar is no longer behaving as a safe-haven asset in the way it historically did. This is a potential structural break in the dollar’s global role, not just a cyclical fluctuation.

⚠ Critical Risk for Israeli Real Estate Dollar Investors

The convergence of factors in 2025–2026 creates a uniquely challenging environment for dollar-based buyers of Israeli real estate:

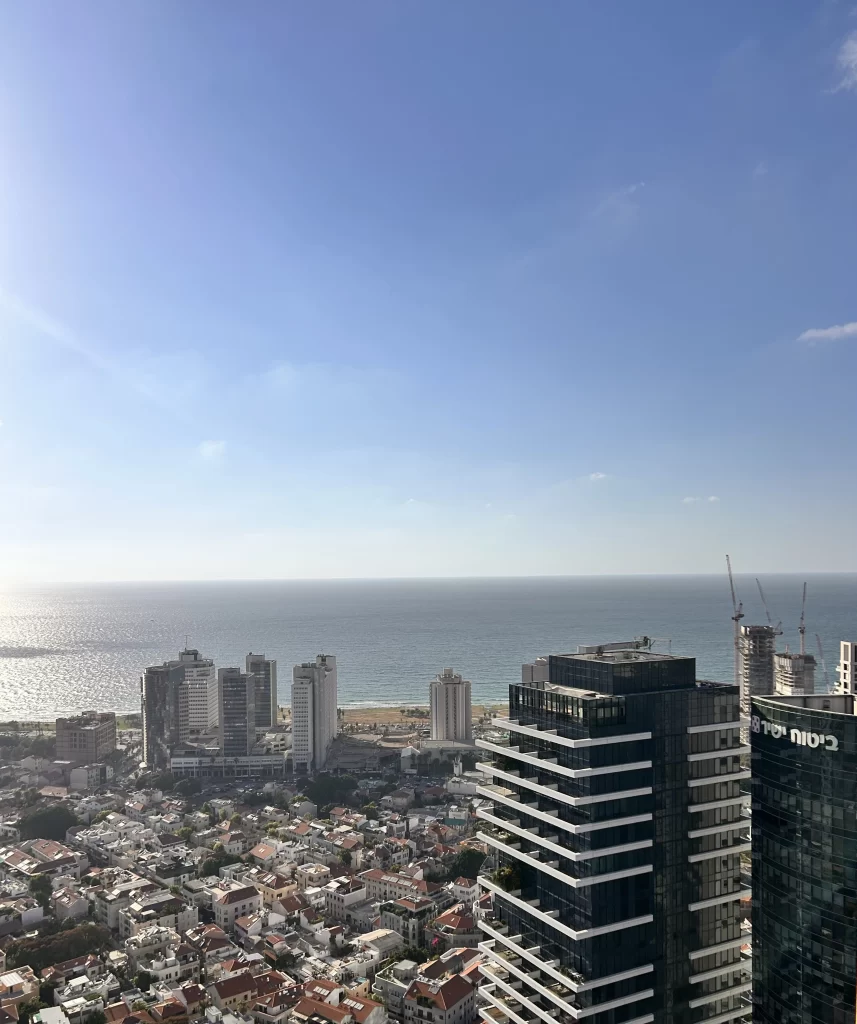
Israeli residential prices in shekel terms have been broadly flat to modestly recovering (post-2023 correction). But dollar-denominated buyers face a compounding currency headwind. A property that was priced at $1M equivalent in January 2024 (at ~3.60 exchange rate) now costs approximately $1.17M equivalent at the ~3.07 rate — a 17% effective price increase in dollar terms even if the shekel price has not moved. This is before any shekel price appreciation is factored in.

If Scenario B (stable range) holds, this headwind stabilizes. If Scenario A (further shekel strength) materializes, the effective dollar price of Israeli real estate continues rising. Only Scenario C or D would provide dollar-buyer relief — but those come with their own risks of economic deterioration in Israel.

◆ ◆ ◆

Part VI — The Analytical Framework: Variables, Weights & Signals

Given everything above, here is the operational framework for tracking USD/ILS and its implications for Israeli real estate dollar buyers. The framework assigns weights to the three primary variables and identifies the leading indicators to watch for each.

Figure 7 · The Three-Variable Dashboard
Current Status of Each Shekel Driver — February 2026
Gauge scale: −5 (maximum shekel weakness pressure) to +5 (maximum shekel strength pressure). Current reading: Variable A (Institutional) = +1.5 (mildly positive; S&P sideways); Variable B (Global DXY) = +3.2 (strongly positive for shekel; dollar still weak); Variable C (Israel Risk) = +2.0 (positive; ceasefire holding but fragile).
Variable Current State Weight in Model Bullish Signal for Shekel Bearish Signal for Shekel
A: Institutional Rebalancing Neutral-to-positive (S&P sideways) 40% S&P 500 sustained rally; TA-125 outperforms; pension inflows strong S&P 500 correction −15%+; global risk-off; capital flight from all EM
B: Global Dollar Cycle (DXY) Positive for shekel (DXY weak) 35% Continued tariff uncertainty; US deficit expansion; Fed rate cuts; global capital reallocation away from USD assets Trade deal resolution; US growth surprise; dollar safe-haven bid returns; tariff ceasefire
C: Israel Risk Premium Positive but fragile 25% Ceasefire holds; Saudi normalization progress; tech exits continue; BoI credibility maintained; aliyah wave Military escalation (Lebanon/Iran); hostage deal collapse; judicial crisis return; BoI credibility undermined; Houthi/Red Sea disruption

Probability-Weighted Projection

Figure 8 · Weighted Projection
Probability-Weighted USD/ILS Scenarios — 12-Month Forward Distribution
Distribution reflects probability weights: Scenario A (25%), Scenario B (35%), Scenario C (28%), Scenario D (12%). Central tendency: ~3.15–3.25. 80% confidence interval: 2.85–3.75. Tail risk to the upside (dollar strengthening) is asymmetric to geopolitical shocks.

The probability-weighted central tendency for USD/ILS over the next 12 months is approximately 3.10–3.30. The distribution is skewed: the downside scenarios (weaker dollar for buyers, stronger shekel) reflect the structural tailwinds currently in place, while the upside scenarios (relief for dollar buyers) require either a US equity correction or an Israeli geopolitical shock — both meaningful risks but against the current trend.

◆ ◆ ◆

Conclusions & Implications

For long-term investors, the most important insight is structural: the shekel is no longer just Israel’s currency. Since approximately 2015–2018, it has become a partial derivative of the S&P 500. The mechanism is clear, empirically documented, and operating through trillions of shekel in pension assets that automatically rebalance against global equity performance. This is not going away — if anything, it will intensify as Israeli pension AUM continues growing.

For dollar-denominated real estate buyers, the current moment (February 2026) is historically challenging. The shekel sits at its strongest level in four years, and the confluence of forces that produced this strength — institutional rebalancing after a strong 2024 S&P run, global dollar weakness, Israeli risk premium compression — are not all reversing simultaneously. A dollar buyer today is effectively making a leveraged bet on either (a) S&P 500 weakness, or (b) Israeli geopolitical deterioration. Neither is a comfortable investment thesis.

The short-term departure from the long-term correlation is real but not permanent. The additional factors (global DXY cycle, tech exits, war premium unwinding) have amplified shekel strength beyond what the institutional rebalancing model alone would predict. This excess strength creates some mean-reversion potential. But the base case is that these factors have additive — not temporary — effects on the shekel’s new structural range.

The dollar’s own structural challenges are the wildcard. If the 2025 DXY decline marks the beginning of a multi-year secular dollar bear market (consistent with historical cycles), then the shekel’s strength is not just an Israel story — it is a USD weakness story that will manifest across all strong-fundamental currencies simultaneously. In that environment, dollar purchasing power for Israeli real estate may decline persistently over a 3–5 year horizon regardless of what happens locally.

The shekel in 2026 is the product of three stories simultaneously: Israel’s extraordinary pension system creating a structural link to Wall Street; a global dollar losing its unquestioned reserve dominance; and a resilient small economy that just weathered its worst shock since 1973 and came out with its currency stronger. Understanding all three is not optional — it is the minimum analytical requirement.

Published February 18, 2026

Previous articles

Tel Aviv Real Estate

Leave your details below and we'll talk soon.

Privacy Policy and Terms of Service apply.

luxury real estate israel

luxury real estate israel

luxury real estate israel

luxury real estate israel

luxury real estate israel

luxury real estate israel

real estate israel

real estate israel

real estate israel

real estate israel
real estate israel

real estate israel

real estate israel

real estate in tel aviv

real estate in tel aviv

real estate in tel aviv

real estate in tel aviv

real estate in tel aviv

real estate in tel aviv

real estate homes

real estate homes

real estate homes

real estate homes
real estate homes

real estate homes

real estate homes

luxury homes in israel

luxury homes in israel

luxury homes in israel

luxury homes in israel

luxury homes in israel

luxury homes in israel

luxury homes

luxury homes

luxury homes

luxury homes
luxury homes

luxury homes

luxury homes

real estate property

real estate property

real estate property

real estate property

real estate property

real estate property

real estate tel aviv israel

real estate tel aviv israel

real estate tel aviv israel

real estate tel aviv israel

real estate tel aviv israel

real estate tel aviv israel

real estate houses

real estate houses

real estate houses

real estate houses
real estate houses

real estate houses

real estate houses

real estate apartments

real estate apartments

real estate apartments

real estate apartments

real estate apartments

real estate apartments

luxury houses in israel

luxury houses in israel

luxury houses in israel

luxury houses in israel

luxury houses in israel

luxury houses in israel

real estate real estate real estate

real estate real estate real estate

real estate real estate real estate

real estate real estate real estate

real estate real estate real estate

real estate real estate real estate

the home apartments tel aviv

the home apartments tel aviv

the home apartments tel aviv

the home apartments tel aviv

the home apartments tel aviv

the home apartments tel aviv

real estate in

real estate in

real estate in

real estate in
real estate in

real estate in

real estate in

real estate real estate

real estate real estate

real estate real estate

real estate real estate

real estate real estate

real estate real estate

luxury estates

luxury estates

luxury estates

luxury estates
luxury estates

luxury estates

luxury estates

luxury homes tel aviv

luxury homes tel aviv

luxury homes tel aviv

luxury homes tel aviv

luxury homes tel aviv

luxury homes tel aviv

a real estate

a real estate

a real estate

a real estate
a real estate

a real estate

a real estate

a properties real estate

a properties real estate

a properties real estate

a properties real estate

a properties real estate

a properties real estate

the luxury estate

the luxury estate

the luxury estate

the luxury estate
the luxury estate

the luxury estate

the luxury estate

property type

property type

property type

property type
property type

property type

property type

real properties

real properties

real properties

real properties
real properties

real properties

real properties

luxury homes real estate

luxury homes real estate

luxury homes real estate

luxury homes real estate

luxury homes real estate

luxury homes real estate

luxury housing

luxury housing

luxury housing

luxury housing
luxury housing

luxury housing

luxury housing

apartment luxury

apartment luxury

apartment luxury

apartment luxury
apartment luxury

apartment luxury

apartment luxury