Zionist Conviction Is Not Enough.
Fortunately, the Numbers Are.
Thirty years of CBS price data, seven wars, diaspora buyer surges, and a 2026 market window. Everything foreign investors need — with zero sentiment and maximum evidence.
The Case You’ve Already Heard — and Why It’s Incomplete
The writer who composed his case for Israeli real estate from inside a bomb shelter was not wrong. He was incomplete. Conviction without data is not an investment thesis — it is a mood. And moods, however sincere, do not survive a board meeting, a wealth manager, or a spouse who wants to understand the numbers before transferring seven figures.
The real case for Israeli residential property has never needed sentiment to stand up. It needs thirty years of CBS price data, a war-by-war impact table, a structural demand analysis, and an honest accounting of what 2026 looks like for a foreign buyer deploying dollars or euros. All of that is below.
The conclusion happens to align with conviction. But it earns that alignment rather than assuming it.
What the Data Actually Shows
Israeli residential real estate has returned approximately 500% in nominal terms since 1995 — roughly 4.8% per annum, compounded, across three decades spanning two Intifadas, three Lebanon wars, multiple Gaza operations, a global financial crisis, a pandemic, and the worst security event since 1973.
| Period | Nominal Return | Real Return | Context |
|---|---|---|---|
| 1995–2000 | +42% | +28% | Oslo-era optimism; tech boom |
| 2000–2007 | −14% | −22% | Second Intifada; global correction |
| 2007–2017 | +118% | +82% | Supply crunch; tech sector boom; 4 operations |
| 2017–2020 | +12% | +6% | Rate-driven moderation |
| 2020–2022 | +44% | +37% | COVID-era demand surge |
| 2022–2024 | +33% | +18% | Despite October 7 war |
The 2007–2017 decade — spanning four military operations — produced +82% real returns, making it one of the strongest residential property decades in any developed economy. The 2000–2007 correction (−22% real) is the only sustained decline in the 30-year record, driven by the Second Intifada combined with the global dot-com crash. Neither condition is present today.
Every Conflict Created a Buyer’s Window
The most counterintuitive finding in Israeli property data: conflict periods have consistently been the optimal entry point for patient buyers. The pattern repeats across seven decades with remarkable consistency.
| Conflict | Peak Drop | +12 Mo | +24 Mo | Recovery Driver |
|---|---|---|---|---|
| Yom Kippur War (1973) | −5% | +12% | +31% | Aliyah inflows; reconstruction demand |
| First Lebanon War (1982–85) | Flat | +28% | +28% | Demographic growth; pent-up demand |
| Second Intifada (2000–05) | −12.6% | +18% | +38% | Supply freeze; credit easing; tech recovery |
| Second Lebanon War (2006) | −1.5% | +10% | +24% | Short conflict; immediate demand return |
| Operation Cast Lead (2008–09) | −2% | +15% | +22% | Post-crisis stimulus; BoI rate cuts |
| Operation Protective Edge (2014) | −1.2% | +8% | +14% | Supply shortage; continuing tech boom |
| October 7 War (2023–24) | −4.4% | +7.8% | TBD | Rate cuts; structural demand resuming |
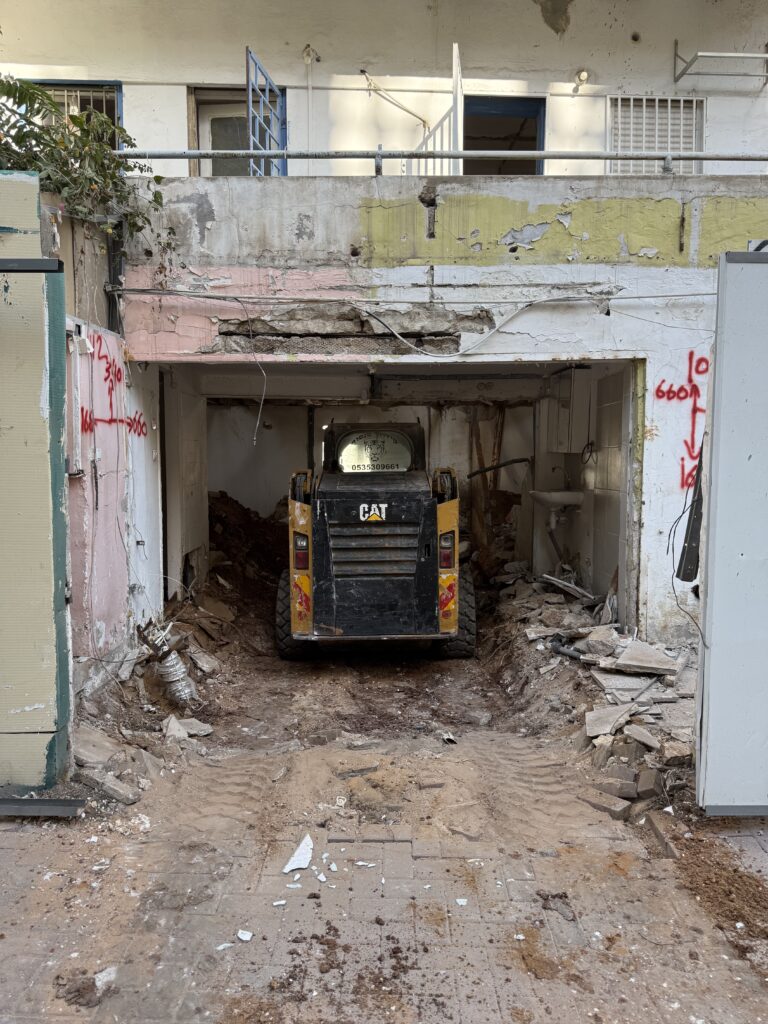
The mechanism is supply, not sentiment. When 40–50% of construction sites shut during escalations, the pipeline contracts precisely when deferred demand accumulates. The rebound is compressed and sharp — not because buyers turn optimistic, but because the market becomes structurally undersupplied faster than in peacetime.
Structural explanation for post-conflict price surges, consistent across all seven conflicts since 1973Why the Floor Is Permanent
Less appreciated than the short-term cyclicality is the structural demand base that creates a durable price floor — one that operates independent of geopolitical conditions.
| Driver | Metric | Implication |
|---|---|---|
| Population Growth | 1.6% annually (highest in OECD) | 55,000–65,000 new units needed per year to maintain equilibrium |
| Supply Deficit | ~59,800 starts/yr average 2015–24 | 5,000–15,000 units per year short of demographic need |
| Aliyah (Immigration) | 31,000 new immigrants Sep 2023–Sep 2024 | Structural buyer base unaffected by conflict; often accelerated by it |
| Land Scarcity | State controls ~93% of Israeli land | Supply cannot easily expand; price floor is permanently structural |
| War Supply Shock | 40–50% of sites shut during escalations | Conflict paradoxically tightens supply, accelerating post-war recovery |
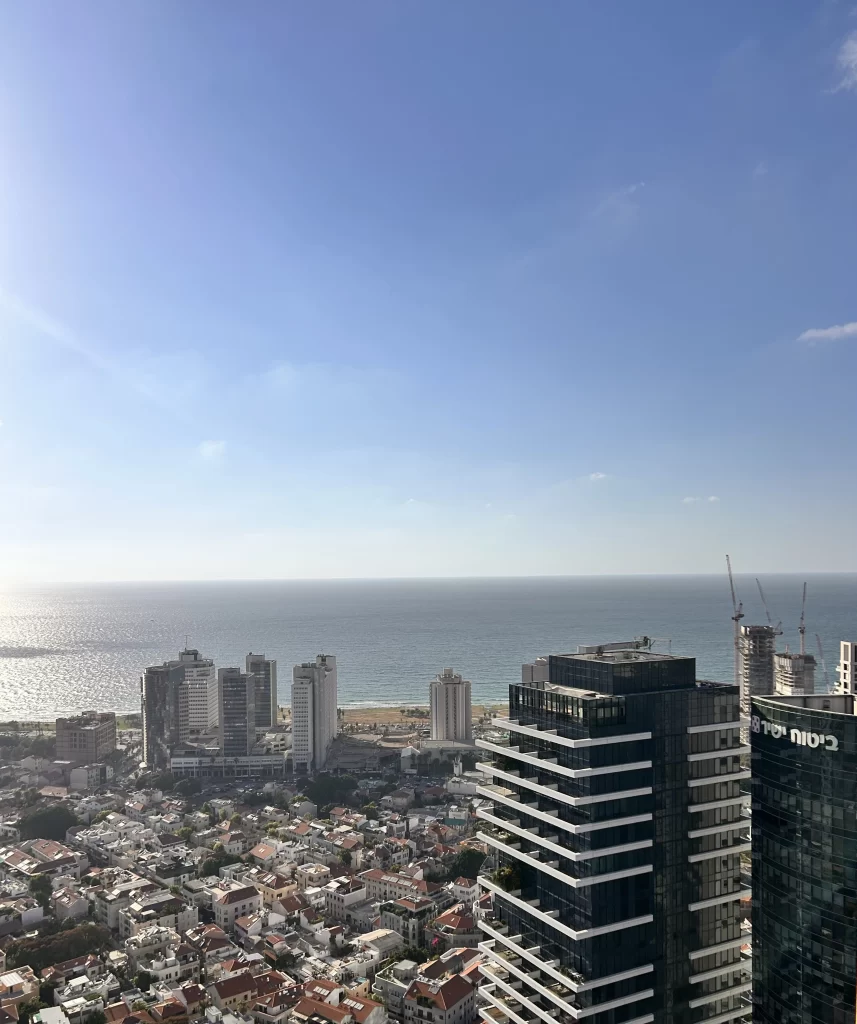
| Tech Sector Incomes | TA tech worker avg salary >$100K USD | Sustains premium demand regardless of macro environment |
Land supply is the decisive constraint. Because the state controls 93% of Israeli land, developers cannot simply build more when prices rise. Unlike London or New York where urban sprawl is theoretically possible, Israeli supply faces a regulatory ceiling that takes years to raise — making demand surges transmit directly into price increases with minimal dampening.
Sentiment or Smart Money?
Diaspora purchase surges do not track yield cycles or interest rate pivots — they track geopolitical anxiety. And that anxiety creates a counter-cyclical demand anchor precisely when local buyers hesitate.
| Period | Volume | YoY Change | Key Driver |
|---|---|---|---|
| Q3 2022 (peak) | ~1,400 units/quarter | High base | Post-COVID, low purchase-tax window |
| Oct 2023 (war outbreak) | Sharp drop | −60%+ MoM | Immediate shock; buyer freeze |
| Dec 2023 | Back to pre-war levels | Recovery | Market reclassified crisis as entry point |
| Sep 2024 | 254 units (single month) | +119% YoY | Antisemitism surge; ‘insurance’ buying |
| 2024 full year | ~2% of all transactions | +50% vs 2023 | Diaspora revival; investor re-entry |
| Early 2026 (forecast) | Continued growth | Moderate | Rate cuts; post-Iran-op normalisation |
The Tax Authority’s 2024 report confirms the premium these buyers pay: foreign residents paid a median price 73% above the general median for investment apartments in 2023. They are not bargain hunters. They are conviction buyers — and their conviction has a quantifiable economic effect on price floors at exactly the moments the market most needs them.
An Israeli apartment is not just real estate for the diaspora buyer — it is an option: a guaranteed right of return to a functional, developed country whose value has risen materially in recent years. That optionality premium is rational, not sentimental.
A Buyer’s Window — If You Read the Room
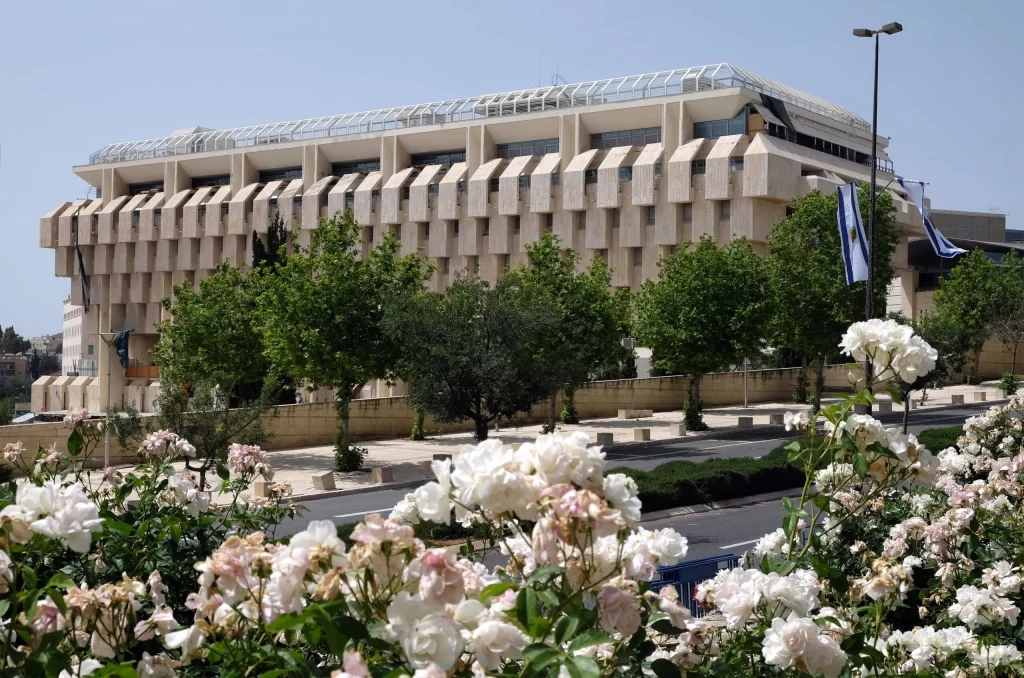
The Bank of Israel cut its benchmark rate to 4.0% in January 2026, forecasting a further decline to 3.5% by Q4 2026. GDP growth is projected at 5.2% for 2026 and 4.3% for 2027. Israel’s sovereign risk premium has returned to near pre-war levels and S&P revised its credit outlook from Negative to Stable in November 2025.
- Unsold inventory record highs — ~188,800 units under construction (Q1 2025)
- Bank of Israel restricted 20/80 & 10/90 developer deals through Dec 2026
- Purchase tax for foreigners: 8–10% upfront — non-negotiable
- Mortgage arrears hit record ₪4 billion in Aug–Oct 2025
- Fiscal deficit 4.7% GDP (2025); debt-to-GDP 68.6%
- Price declines 7 consecutive months through Sep–Oct 2025
- BoI rate cut to 4.0% Jan 2026; forecast 3.5% by Q4 2026
- GDP forecast +5.2% (2026) and +4.3% (2027)
- Israel CDS spreads near pre-war levels
- S&P revised Israel outlook: Negative → Stable (Nov 2025)
- Foreign buyer transactions +119% YoY (Sep 2024)
- Widest negotiating margin since 2018 — 2–6% below ask
Three Scenarios for 2026–2031
Saudi normalisation, stable coalition, fiscal consolidation. Rate cuts stimulate faster-than-expected demand recovery.
U-shaped bottom. Prices stabilise 0–2% through mid-2026. Rate cuts to 3.5% by Q4. Grinding multi-quarter adjustment.
Coalition collapse, renewed hostilities, accelerating brain drain. Best long-horizon entry point if it materialises.
What a Sophisticated Foreign Buyer Actually Needs to Know
Conviction is the beginning of the decision, not the end of it. The Israeli market’s mechanics are genuinely complicated for non-residents.
The Thesis That Has Earned the Right to Its Sentiment
The phrase “Zionist investor” ought to be a rigorous description, not an emotional one. Zionism was, at its core, a practical project of building durable institutions in a small and contested piece of land, under continuous external pressure. It succeeded because its architects were simultaneously idealistic and brutally pragmatic.
The same standard applies to investing in the country those architects built. The idealism is warranted — thirty years of data, seven wars, and a structural demographic engine have earned it. But it must be paired with rigorous underwriting: real net yields, total acquisition cost, location discipline, and an honest time horizon.
The Israeli property market has returned roughly 500% over 30 years — through Intifadas, three Lebanon wars, October 7, and a pandemic. That is not sentiment. That is one of the most durable capital appreciation records in the developed world.
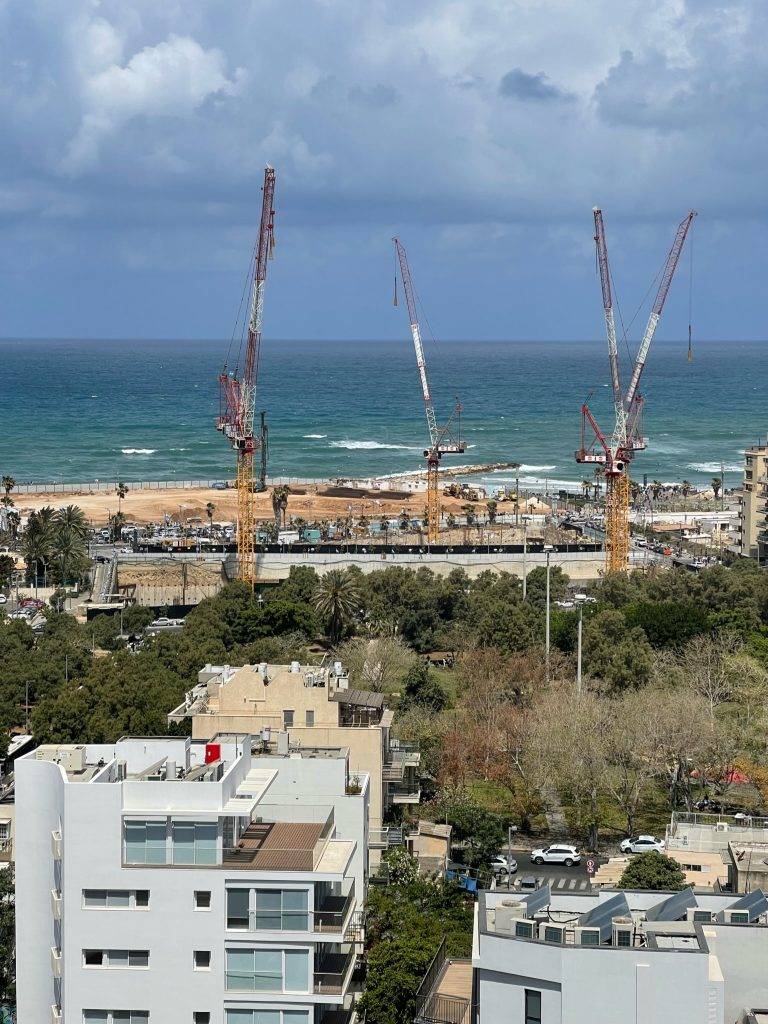
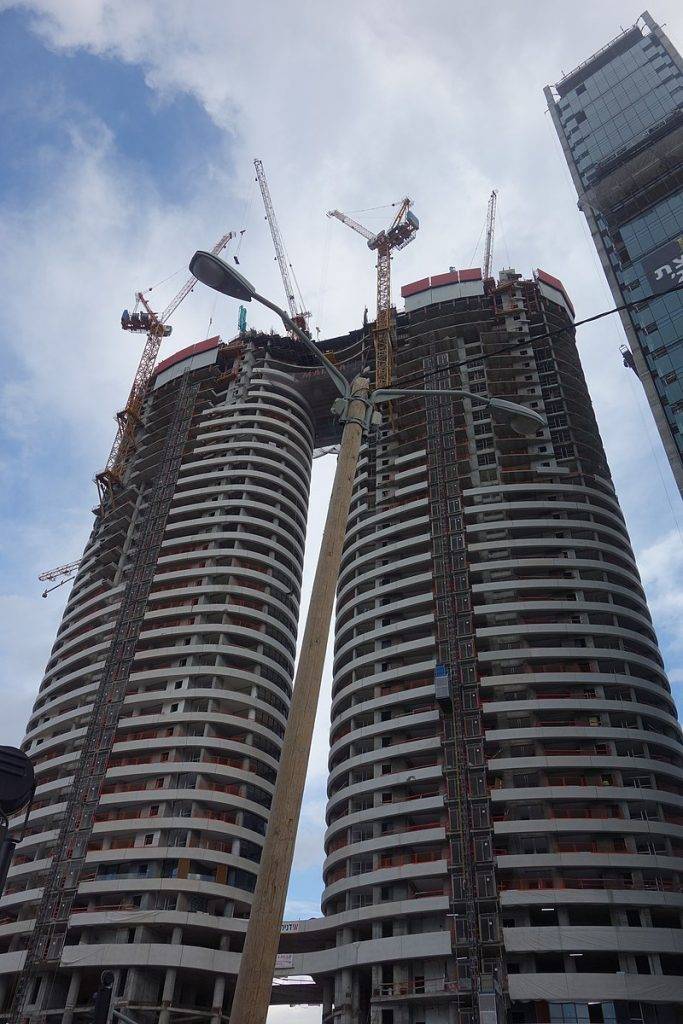
— 30-year CBS Housing Price Index analysisThe cranes return because the structural forces — demographic growth, land scarcity, a high-income technology economy, and a diaspora with both the means and the motivation to invest — do not pause for headlines.
Buy with conviction if you have it. But buy with data. The market will reward both.
Data Sources
Bank of Israel Research Department Staff Forecast (January 2026); Bank of Israel Monetary Committee Decision (November 2025); IMF Article IV Mission Staff Concluding Statement, Israel (February 2026); Israel Central Bureau of Statistics Housing Price Index and Transaction Data; Israel Tax Authority Real Estate Tax Revenue Report 2021–2024; BIS Residential Property Prices Database; Global Property Guide Israel Market Analysis Q3 2025; Tel Aviv University Alrov Institute for Real Estate Research; Taub Center for Social Policy Studies; Times of Israel real estate reporting; Globes financial reporting; Sands of Wealth Tel Aviv and Israel Market Reports 2025–2026; S&P Israel Credit Rating Action November 2025.
Disclaimer: This article is for informational purposes only and does not constitute financial, legal, or investment advice. All real estate investment carries risk. Tax obligations vary by buyer nationality and treaty status. Consult a qualified Israeli tax attorney and licensed real estate professional before purchasing. Past performance is not indicative of future results.